Do You Know the Ideal Household Budget Percentages


Inside: Find out the ideal household budget percentages. Find out how much you should be able to save each month and get a monthly spending plan for your family.
What are good budget percentages?
Honestly, that is a really good question and we will dig into the answer shortly. Also, you may be surprised to learn how we, at Money Bliss, differ from many others like Dave Ramsey and the average person.
The reason why we are different is because we are focused on helping you enjoy life and money.
That means you need to make smart money decisions today that will make the long run easier.
When setting up a budget for the first time or trying again for the tenth time – honestly, it isn’t the most fun thing to do in the world. You are trying to figure out how much should I budget for each category? You feel like you can’t make your expenses less than your income.
Before you know it, making a budget feels like a circle and you are the square trying to jam yourself in there.
Believe me, I get it.
In order to better prepare for life’s curveballs, it’s important that you have an idea of what the ideal budget percentage should be based on your income level.
This post will give you some insight into household budget percentages based on:
- Average Annual Budget Percentages (what people do without really knowing)
- Budget Percentages Dave Ramsey
- Money Bliss “Cents Plan” method for budget percentages.
Plus we have a budget percentages calculator for you to figure out your exact monthly budget percentages!
Our Path to Using Budget Percentages
Back as a newly married couple, we were trying to budget (or better said, live within our means). Sometimes it felt like nothing would work. Like there wasn’t enough money to go around. Plus we were transitioning to one income. Trying to figure out a budget seemed like an impossible task.
Thankfully, we preserved through our initial attempt.
We made a budget that works. Learned our money lessons. Had our ups and downs. Paid off $53,000 of debt in one year. Now, we are working our way to financial independence.
One great way to get ahead on making a budget is knowing the typical household budget percentages.
So, let’s dive in and figure out what percentage of income should go to each category to create your ideal monthly budget.
This post may contain affiliate links, which helps us to continue providing relevant content and we receive a small commission at no cost to you. As an Amazon Associate, I earn from qualifying purchases. Please read the full disclosure here.
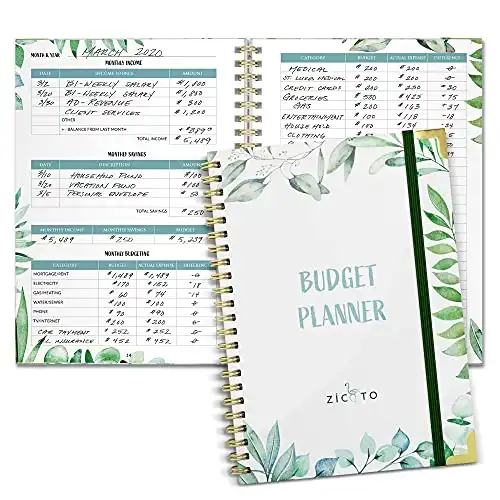
Achieve your financial goals and use this budget tracker to set new financial standards in your life, monitor your monthly income, savings, debts & daily expenses.
How to Start with Household Budget Percentages

A budget is a plan for spending money.
It can be as simple as a list of daily expenses and monthly income, or as complicated as a spreadsheet with different scenarios for how much you should spend and save each month.
When trying to figure out what is your household budget, it helps to start with household budget percentages.
1. Use Gross Income
First, everything is based on gross income. That means the total earned before taxes. Not the amount on your paycheck or deposited into your bank account.
Why should taxes be included? Paying taxes is a part of life and a very smart lesson to know how much in taxes you pay each and every pay period.
(Okay, if using your gross income it too difficult, then use net income. Just realize your home budget percentages will be higher than the recommended.)
2. Find your Numbers
Now, you need to multiply your income by each of the household percentages.
Use the household budget percentage worksheet to help determine how much should I spend on each budget category.
This awesome free printable can be found in our resource library.
Grab a calculator to start figuring out your household budget based on the ideal household budget percentages.
That is the easy part.
3. Compare the Differences
This is the step where most people lose interest and quit trying to improve their budget skills.
The hardest step is tracking your personal spending and comparing it to the ideal household budget percentages.
If you have never used a budgeting app to track your spending, then look at your credit card or bank statements. Many of them now provide annual spending.
While those numbers won’t be exact, it is a good place to start.
When you are comparing your actual spending to your ideal household budget, what areas can you identify that need to be reigned in or money should be saved?
Looking for a digital option for your budget that is better than Mint?


Enjoy guilt-free spending and effortless saving with a friendly, flexible method for managing your finances.
Average Annual Household Budget Percentages
These numbers come straight from the U.S. Bureau of Labor Statistics. They look at the national average across many different factors to come with the budget percentages. This is quite an in-depth study where you can read more here.
As you will quickly see, the average annual home budget percentages are quite different than our recommended budget percentages.
Why such a difference?
The average American doesn’t save money. That is a sad, but true fact. In this post, we are outlining percentages for a household budget that will guide you to a different way of life. One that is savvy with money and helps you to reach your money goals.
That is our purpose at Money Bliss and we hope you stick around to learn more.
Just to footnote before digging in, some assumptions (see below) were made to the data provided to reach the below table.
Category |
Average Annual Percentage |
| Giving | 0% |
| Savings | 2.79% |
| Housing | 20.1% |
| Utilities | 5.2% |
| Food | 10.24% |
| Clothing | 2.41% |
| Transportation | 12.12% |
| Medical | 6.18% |
| Life Insurance | .43% |
| Education | 1.94% |
| Personal | 1.40% |
| Recreation/Entertainment | 5.19% |
| Debts | 0% |
| Total Government Tax (including Income, Social Security & Medicare) | 22.76% |
| Unknown Spending | 9.19% |
| 100.00% |
**Following Categories were combined: Entertainment & Miscellaneous, Personal & Tobacco, Reading & Education
**Following Categories were separated: Housing & Utilities, Life Insurance & Social Security
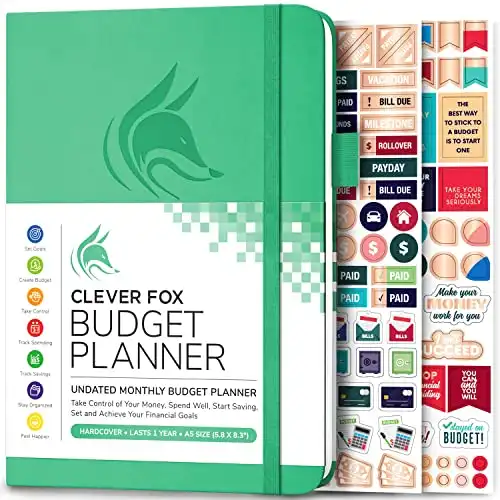
Clever Fox Budget Book will help you keep your money organized, spend well, start saving, set and achieve financial goals.
Recommended Ideal Household Budget Percentages

The key to answering the question on how much should I budget for each category is to make sure everything adds up to 100%. You can’t make a budget work when you allocate 105% to various categories. You are already 5% over on paper. So, the reality isn’t going to be much better (that means you are accumulating debt).
These budget category percentages recommendations are to live a full life and not be a slave to money. Specifically a slave to debt.
There is a priority put on saving money and we believe that makes an ideal budget work.
By saving for your future, you are more likely to reach financial freedom. You are likely able to pay off debt faster. Maybe retire early. Change jobs. One partner can stay home with the kids. Money saved opens up opportunities.
There are many options when there is a sizable cushion of money.
For more information on how much you need to reach financial freedom, read our Money Bliss Steps to Financial Freedom. That is a must read!

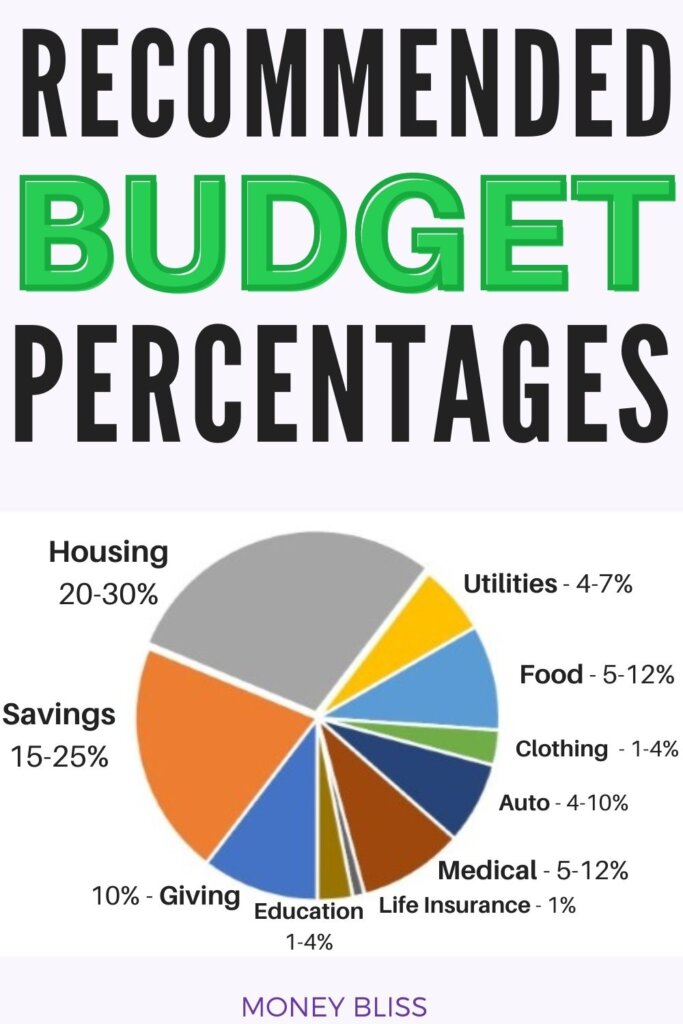
Here are the recommended budget percentages:
Category |
Ideal Recommended Percentages |
| Giving | 10% |
| Savings | 15-25% |
| Housing | 20-30% |
| Utilities | 4-7% |
| Food | 5-12% |
| Clothing | 1-4% |
| Transportation | 4-10% |
| Medical | 5-12% |
| Life Insurance | 1% |
| Education | 1-4% |
| Personal | 2-7% |
| Recreation/Entertainment | 3-8% |
| Debts | 0% |
| Total Government Tax (including Income, Social Security & Medicare) | 15-25% |
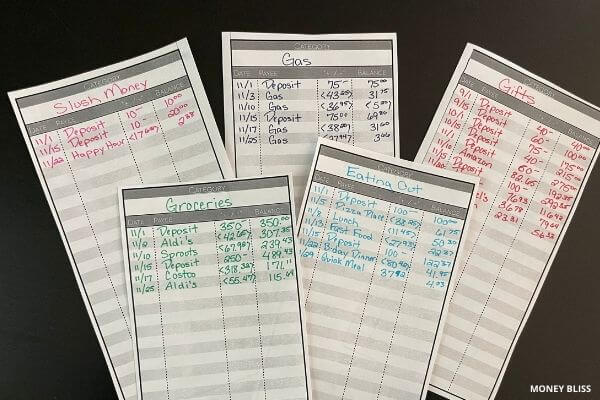
Save Money Resource using the 100 envelope challenge.
Dave Ramsey Budget Percentages

In Dave Ramsey’s “Financial Peace University,” he teaches a method of budgeting for your money while using the “7 Baby Steps.”
The Dave Ramsey budget is a percentage-based set of rules for living within your means. The plan is divided into percentages, which are then allocated to different areas of the budget such as food, housing, savings, and debt.
Dave Ramsey’s zero-based budgeting method is the most thorough of all, allowing for more accurate projections of household finances. It also allows users to adjust their spending habits and live on less than they earn every month.
The Dave Ramsey budget percentages are based on his own family’s needs in addition to inflation that will occur each year (he does not account for any changes in lifestyle).
Based on the Dave Ramsey budget percentages, you would set aside the following into assorted categories:
- Charity – 10%
- Savings – 10-15%
- Food -10-15%
- Utilities – 5-10%
- Housing: 25-30%
- Transportation: 10%
- Health – 5-10%
- Insurance: 10-25%
- Recreation/Entertainment – 5-10%
- Personal -5-10%
Why the Difference in Basic Budget Percertages?

The first reaction to the average annual spending is people do not save.
No wonder our society is full of debt and barely scrapping by living paycheck to paycheck. Setting aside a measly 2.79% each year will never allow financial independence – let alone retirement. Here is what happens when you don’t save for retirement.
Did you catch the unknown spending line?
That is 9.19% we couldn’t account for in their numbers. Where was that money spent? Go ahead and make your assumptions. Personally, I have my ideas.
Enjoy guilt-free spending and effortless saving with a friendly, flexible method for managing your finances.
Debt payments were not mentioned in their study. So, I have no idea if auto loans were lumped together with transportation. The average household debt is high and continues to grow each and every year. So, for intents and purposes, we left that number at 0% since more than likely debt is included elsewhere.
Also, income taxes were not included in the study. However, every April 15th income taxes are due. Hmm. Personally, that is an interesting item to note. In the situation, we assumed based on the income on what federal and state income taxes would be. The numbers we used can be found here.
As for the Dave Ramsey budget percentages, he made those numbers famous and many people have found money success, which is awesome!
However, there is not enough emphasis on saving money, which can be a detriment. Also, it can allow spending to increase more than necessary.

Aligning with Cents Plan Formula
The important note on the Cents Plan Formula is it lumps all of the smaller categories into a bigger chunk. When creating a budget, there needs to be solid boundaries especially since money management isn’t a taught subject at school.
The goal is no debt because debt will hold you back financially. Random acts of kindness and paying it forward help sustain our society.
By lowering basic expenses, then more money frees up to be saved or for fun spending.
That is the key to the Cents Plan Formula is the flexibility to spend and save where you need. Thus, taking out the constrictions of a budget.
Cents Plan Formula |
Recommended Budget Percentages |
| SAVE – 20% | |
| Savings | 15-25% |
| BASIC EXPENSES – 50% | |
| Housing | 20-30% |
| Utilities | 4-7% |
| Food | 5-12% |
| Clothing | 1-4% |
| Transportation | 4-10% |
| Medical | 5-12% |
| Life Insurance | 1% |
| GIVING – 10% | |
| Giving | 10% |
| FUN SPENDING – 20% | |
| Education | 1-4% |
| Personal | 2-7% |
| Recreation/Entertainment/Memberships | 3-10% |
| Travel | 2-5% |
| DEBT – 0% | |
| Debts | 0% |
In the Cents Plan Formula, it looks at net income. Simply put after taxes. So, the government taxes (income taxes, social security, medicare) of 15-25% aren’t included.
For some, especially those who hate to budget, it is a simpler way to look at a budget.
Find more detail on how to budget your money with percentages.
Home Budget Percentages Example
Next, let’s use an example to figure out your ideal monthly budget for rent.
Take your gross income and multiply by the recommended ideal household budget percentages. But wait, you may see two sets of different percentages? Don’t worry. That will be explained a little bit later in the post.
For example, annual income is $55,000. The recommended housing category percentage is 20-30%.
$55,000 times .2 equals $11,000.
$55000 x .3 = $16,500.
The budget for housing would be $11,000-$16,500 annually.
Then, take those numbers and divide by 12. That number would be the monthly amount to budget.
Divided by 12 months. Your total housing costs should be between $917 – 1,375 per month.
This time, let’s figure look at another ideal monthly budget for food.
Take your monthly gross income and multiply by the recommended ideal household budget percentages. This time we are looking at food.
For example, monthly gross income is $5,000. The recommended food category percentage is 5-12%. The spread on food varies due to access to fresh fruits and veggies, dietary restrictions, and the number of people in the family.
$5,000 times .05 equals $250.
$5,000 x .12 = $600.
The monthly budget for food would be $250-600.
Related Resource: The 60 [BEST] Budget Grocery List for Cheap Eating
Budget Percentages Calculaotr
Here is a calculator to make finding your budget percentages a breeze!
Now, What Are Good Budget Percentages?

Why two charts??
Simple.
One is how the average American currently spends their money.
The other one is the ideal recommended budget percentages.
Which one do you want to live by?
Financial Freedom or Paycheck to Paycheck?
The choice is yours.
At Money Bliss, we wanted to present both household budget percentages. Review the charts and find the differences.
This is where you learn to leave differently than the other ninety-nine percent of society?
Make sure you know the reason to put a priority on your savings percentage.


Factors Affecting the Average Family Budget:
There is no cookie cutter formula for everyone. We all have our own experiences and influences that are going to affect our budget category percentages.
Just remember, the ideal household budget percentages are a guide.
For instance, the presence of debt is going to weigh heavily on any budget. Getting out of debt takes a plan and perseverance to happen. Other categories will suffer while tending to paying off debt. More reading on how to get out of debt fast.
These are the common effects on the average family budget:
1. Spending Varies by Income level
Income varies. Spending varies. Typically, higher income earners spend more money because of more obligations. However, that doesn’t mean they are savers.
Regardless of income level, all households should be conscious that spending is less than income.
Learn how much do I make per year.
2. Number of People in Household
Costs are higher for each person in the family. For instance, grocery budget is much higher in a family of 6 than a couple. Therefore, a bigger family will lean towards the higher percentage.
3. Location
In real estate, they always say, “Location. Location. Location.” When it comes to budget category percentages, cost of living will be affected big time.
A high cost of living area will blow any budget especially if the income doesn’t align to the location.
A low cost of area will speed up the path to wealth and financial freedom.
4. Stage of Life
When you are just starting out and don’t have many obligations, there tends to be higher discretionary spending (even though you should be saving more). Once obligations start trickling in (ie: kids and homes), then basic expenses tend to rise. Hopefully, when entering retirement age, the home mortgage is paid off and therefore your housing costs are minimal.
The stages of life have a huge impact on your financial situation.
5. Shackled by Debt
Ugh. That four letter word again. DEBT. Seriously, it is the cash flow killer. It is impossible to make progress with your personal finances with debt holding you back. Make a plan and get out of debt now. Stop putting it off.
Did you know…How to Budget Money and Still Enjoy Life?
Ready to use the Suggested Budget Percentages?
Did you get your problem solved? Trying to figure out household budget percentages doesn’t have to be an exact science.
The biggest factor is spending less than income.
Here we laid out guidelines to help determine your household budget. Make sure to download the Cents Plan Budget to start the process.
Remember, to always start with your fixed expenses.
What is your household budget? Let us know in the comments.

Did the post resonate with you?
More importantly, did I answer the questions you have about this topic? Let me know in the comments if I can help in some other way!
Your comments are not just welcomed; they’re an integral part of our community. Let’s continue the conversation and explore how these ideas align with your journey towards Money Bliss.